In graphs: London house prices no longer the fastest growing in the UK

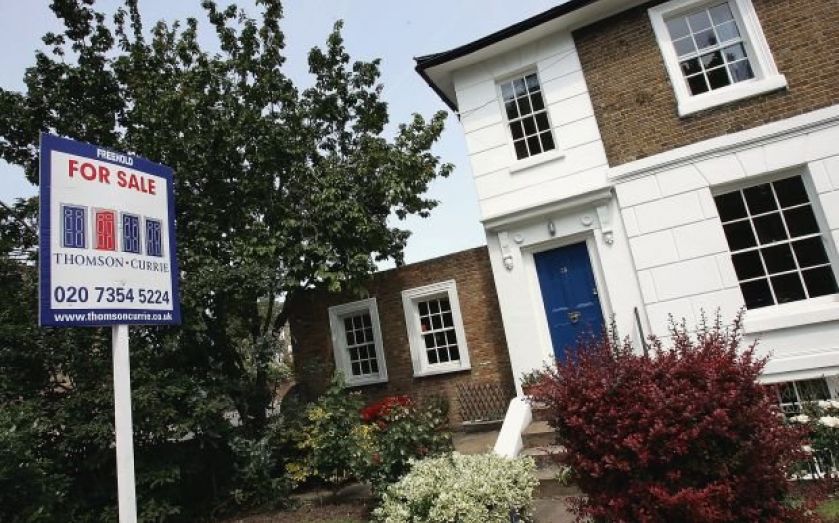
The Land Registry has released new data on house prices in England and Wales and the figures show the market is cooling.
The average across England and Wales shows that prices are stagnant – showing no change at all. The average selling price for a house in England and Wales during June was £172,011: a zero per cent monthly change and a 6.4 per cent rise compared to June 2013.
The average price of a house in London however increased by only 0.1 per cent – pretty much stagnant.
The Land Registry works out its figures by looking at all the sales across the country. Sales have been increasing year on year, with 65,679 sales taking place between January and April 2014, up from 48,597 in the same period in 2013.
A look at the data by county shows that there are differences between different areas of the country. The map below shows the most recent changes in the market. By clicking on your county you can see monthly and annual changes as well as the average selling price of a house.
To scroll down on mobile, please swipe to the right of the map:
Here are some graphs breaking down the data to find the outliers. First here are the 20 counties showing the biggest monthly swings (10 biggest increases and 10 biggest decreases). It is also interesting that although London prices have grown the most over the last year, they did not grow the most in June.
Over the course of twelve months the changes are more pronounced, but all of them fall below the 10.5 per cent increase measured using data from the council of mortgage lenders. The Registry data is more accurate because it includes all purchases, rather than a selection of mortgage lenders.
These are the 10 cheapest and the 10 most expensive places to buy a house in England and Wales, excluding London. When data from the capital was included, the top 10 was made up entirely of London boroughs. You can see that list in the next chart.
Here are the most expensive London boroughs (and the most expensive areas in the UK):
Another piece of data to come out of the report is that not all house types have increased evenly over the last 12 months. Flats have actually increased the most, which could well be because London has seen the biggest rises in average price, and the average price of a house in the capital is high enough to mean people tend to look to buy a flat rather than a house.
One final chart to complete the picture, and this one shows how house prices have change across different regions. Click on the tabs at the top to flit between measures.
So what are the reasons for the slowdown? Many fingers will be pointing to new MMR restrictions on mortgage spending which aim to keep the amount home buyers borrow at a sustainable level. Other candidates include a change in buyer sentiment meaning the demand has come slightly below supply: meaning less upward pressure on prices.
Howard Archer of IHS Global Insight said:
The Land Registry data for June suggest that house prices have temporarily at least lost momentum amid a recent cooling in activity which has been influenced by the introduction of new regulations under the Mortgage Market Review (MMR). Admittedly, data from the British Bankers Association indicates that mortgage approvals picked up to a limited extent in June but they remained below the peak levels seen earlier this year.
Furthermore, a survey released in late-July by the Halifax indicated that people have become much warier about buying a house. Specifically, the balance of people who felt it was a good time to buy fell sharply from +34 to +5 in the second quarter, which was the largest fall since the survey began in April 2011.
[cam_houseprices]
This graph shows year-on-year percentage changes in house prices, as calculated by Halifax, the Land Registry and Nationwide. They are not seasonally adjusted.